The Stats Guy
Every statistic we publish is listed here with (1) the raw data to download as CSV, (2) the step-by-step arithmetic, (3) the sources, and (4) the caveats. You should be able to follow each calculation yourself, in a spreadsheet, from the files on this page.
All figures are calculated by The Stats Guy from the sources named under each stat. Flight data are monthly exports of taxprivatejets.org, so the flight rows and tables are provided here as CSV (the full file of 5.6 million flights is too large to host; the tables here are what each calculation needs, and the event sections list every flight).
A flight is a row of the tracker data whose takeoff and landing airports differ. Rows that land where they took off (3.3% of 2025 rows) are left out of every count, because they have no destination. CO2 means tonnes of CO2 from the fuel burned in flight (tank-to-wake); a few rows (0.02% in 2025) have no CO2 value and add nothing to the totals.
Own counts or published figures? Every number here is calculated by The Stats Guy from the sources named under it. The COP30 and Davos counts are landings in a window compared with the same dates a year earlier.
COP30, Belém: private jets landing during the summit
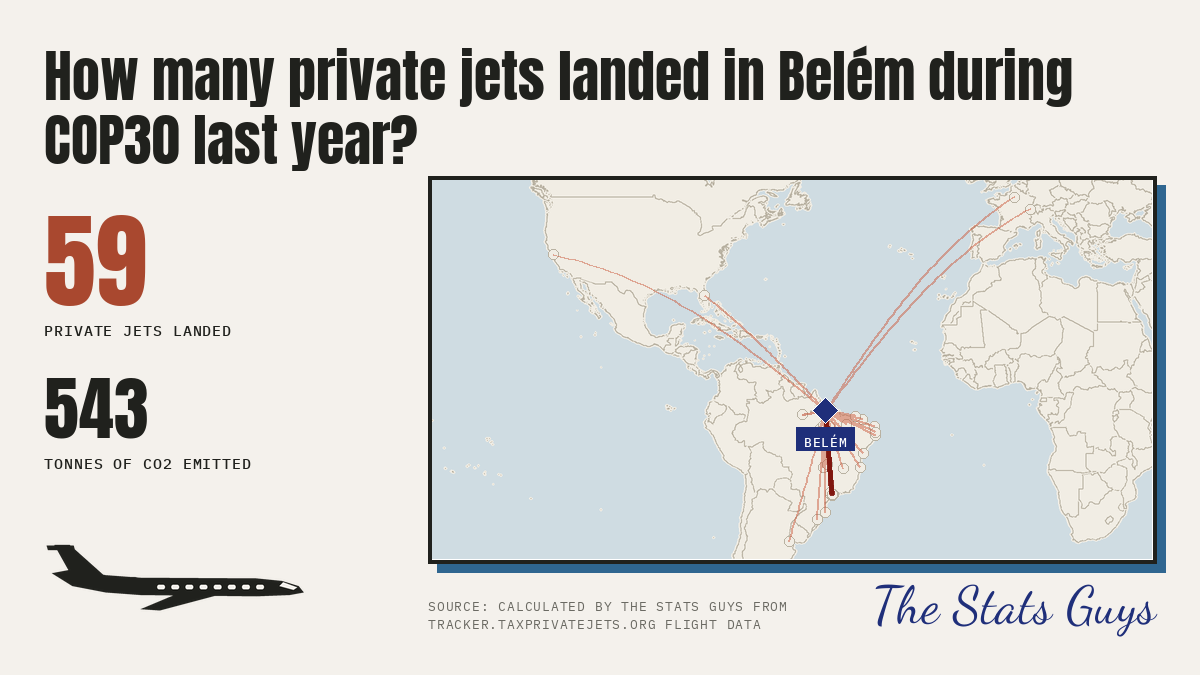
59 private jets landed at Belém airport (SBBE) on 8 to 22 Nov 2025, 543 tCO2. The same dates in 2024 (the 2024 export starts on 10 Nov): 10 jets, 87 tCO2.
1 Raw data (download)
- event_cop30_flights.csv
Tracker export rows landing at Belem airport (SBBE): 2025 8 to 22 Nov (this_year) and 10 to 22 Nov 2024 (last_year). Rows are copied from the tracker CSVs in data/cop30.
2 Step by step
- Download the four tracker exports for the Belém box (
-1.55,-48.60,-1.30,-48.35): 3 to 10 Nov 2025, 10 to 22 Nov 2025, 22 to 29 Nov 2025, and 10 to 22 Nov 2024. Rows are copied unchanged intoevent_cop30_flights.csv. - Keep rows whose Landing airport is SBBE and whose Takeoff airport is not SBBE; remove any duplicate (registration + landing time).
- Count all the rows (8 to 22 Nov 2025) and add the tCO2e TTW column: 2025 = 59 flights and 543 t; 2024 (export covers 10 to 22 Nov) = 10 flights and 87 t.
- The animation runs 8 to 22 Nov 2025 (59 flights); the 8 and 9 Nov days have no 2024 comparison because the 2024 export starts on 10 Nov.
3 Sources
- Flights: taxprivatejets.org exports, business jets, bounding box above. Calculated by The Stats Guy.
- Dates: COP30 official site (10 to 21 Nov 2025).
4 Caveats and limits
- This export used the tracker's Adapted Travel Impact Model for CO2, while the other events use the EUROCONTROL Fast Model. The two are of similar size (for the same 51 landings: 451 t against 459 t) but not identical, so do not compare COP30's tonnes with the other events' tonnes.
- Small numbers: 59 jets is a handful of flights, not a trend.
- The tracker box counts business jets only.
- A flight is a row of the tracker data whose takeoff and landing airports differ. Rows that land where they took off (3.3% of 2025 rows) are left out of every count, because they have no destination. CO2 means tonnes of CO2 from the fuel burned in flight (tank-to-wake); a few rows (0.02% in 2025) have no CO2 value and add nothing to the totals.
Davos: World Economic Forum 2026
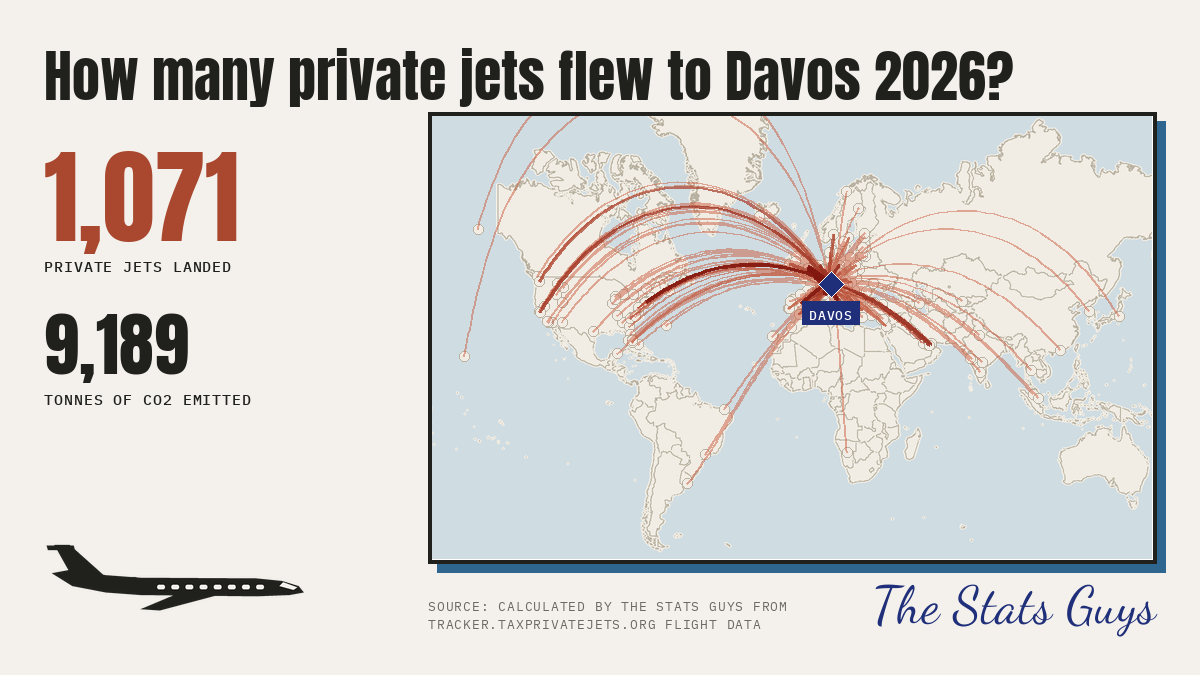
1,071 private jets landed within 160 km of Davos, 2026-01-17 to 2026-01-24: 9,189 tCO2. The same dates a year earlier: 956 jets, 7,448 tCO2.
1 Raw data (download)
- event_davos_flights.csv
One row per flight landing within the circle in the window (this_year) and on the same dates one year earlier (last_year). - event_airports.csv
Every airport that counted, with coordinates (OurAirports) and its distance from the event centre. - event_definitions.csv
The circle (centre and radius) and the window used for each event.
2 Step by step
- Take every row of the flight data whose landing_time (UTC) falls from 2026-01-17 to 2026-01-24 (two days before the event to the day after) and whose takeoff and landing airports differ.
- Keep rows whose landing airport is within the radius of the centre: distance = haversine from the airport's latitude and longitude (OurAirports) to the centre.
event_airports.csvlists every airport that counted and its distance. - Count the rows: 1,071. Add the tco2 column: 9,189 t.
- Repeat for the same calendar dates one year earlier (rows marked
last_year): 956 flights, 7,448 t. - On the graphic the counters grow as each flight's landing time passes; each line is one origin airport to the landing airport, thicker and darker the more flights shared it.
3 Sources
- Flights: monthly "Flights CSV" exports of taxprivatejets.org. Emissions: EUROCONTROL Fast Model, in-flight fuel only (tank-to-wake), well-to-tank switched off. Calculated by The Stats Guy.
- Airport coordinates: OurAirports airports.csv.
- Dates: Al Jazeera (19 to 23 Jan 2026).
4 Caveats and limits
- A flight is a row of the tracker data whose takeoff and landing airports differ. Rows that land where they took off (3.3% of 2025 rows) are left out of every count, because they have no destination. CO2 means tonnes of CO2 from the fuel burned in flight (tank-to-wake); a few rows (0.02% in 2025) have no CO2 value and add nothing to the totals.
- Landings are counted at every airport in the circle, so they include everyone who flew there, not only people attending the event. We do not know who was aboard or why.
- The 160 km circle takes in Zurich, St. Gallen, Friedrichshafen and Milan Linate, so many of these flights are for other reasons.
Private jet flights that stay in the US
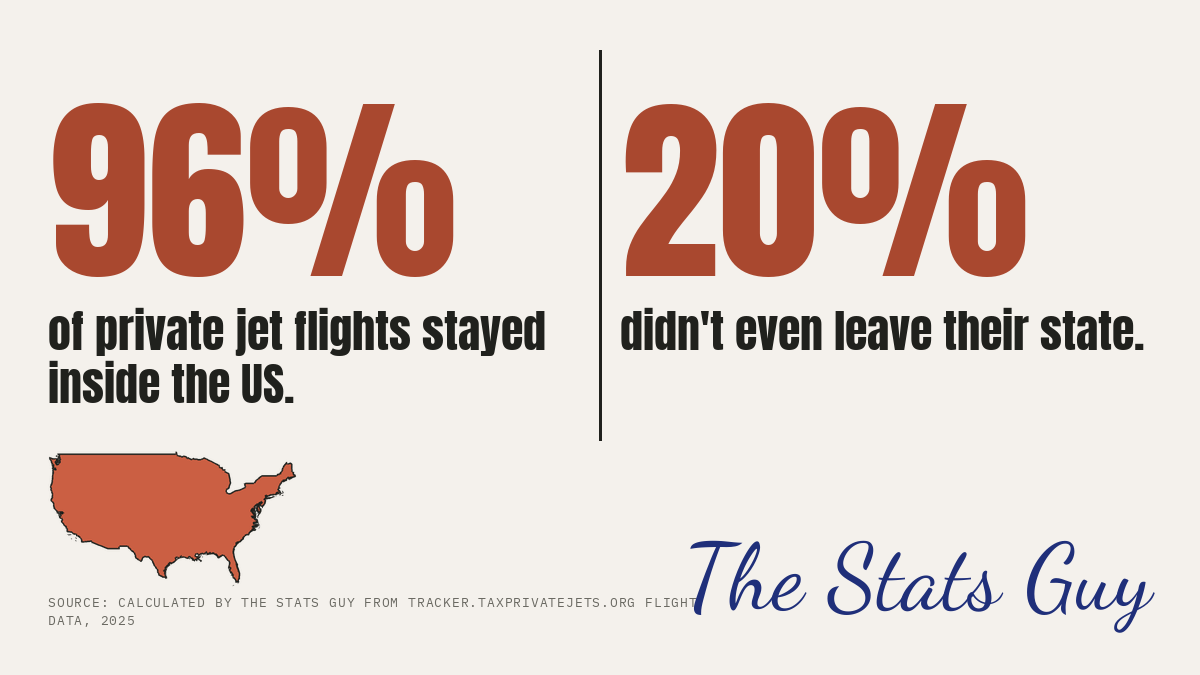
96% of private-jet flights leaving the US in 2025 landed in the US; 20% landed in the same state they took off from.
1 Raw data (download)
- us_departures_2025_by_state.csv
2025 flights leaving the US (takeoff and landing airport different), by state of takeoff. - us_departures_2025_by_landing_country.csv
The same flights by country of landing.
2 Step by step
- Take 2025 rows whose takeoff country is the US and whose takeoff and landing airports differ: 2,318,182 flights.
- Of those, landing country US: 2,220,575 (95.79%). Landing state equal to takeoff state: 474,316 (20.46%).
- Sum the columns of
us_departures_2025_by_state.csvto get the same figures.
3 Sources
- Flights: monthly "Flights CSV" exports of taxprivatejets.org. Emissions: EUROCONTROL Fast Model, in-flight fuel only (tank-to-wake), well-to-tank switched off. Calculated by The Stats Guy.
- Airport coordinates: OurAirports airports.csv.
4 Caveats and limits
- Loops (56,789 US rows landing where they took off) are excluded; including them the figures would be about 96% and 22%.
- State comes from the airport's region code; a handful of rows have none and count as not 'same state'.
- Flights that land in US territories (Puerto Rico, Guam) count as not in the US because the data labels them with their own country code.
- A flight is a row of the tracker data whose takeoff and landing airports differ. Rows that land where they took off (3.3% of 2025 rows) are left out of every count, because they have no destination. CO2 means tonnes of CO2 from the fuel burned in flight (tank-to-wake); a few rows (0.02% in 2025) have no CO2 value and add nothing to the totals.
Where private jet flights start: the United States
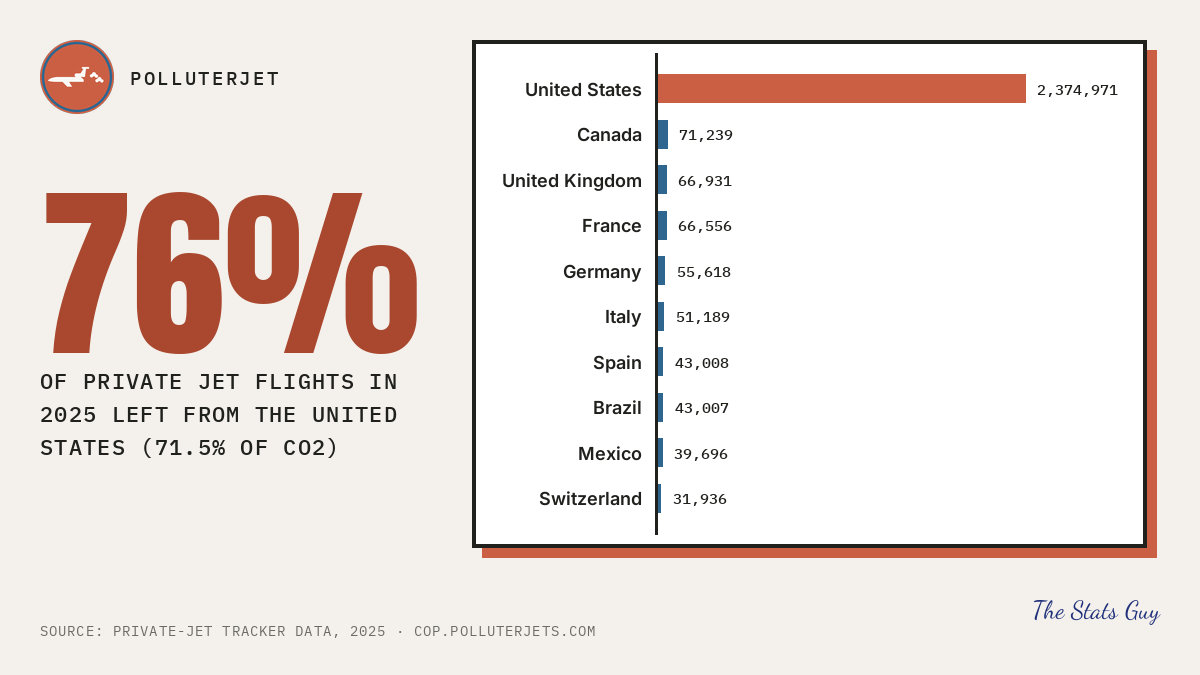
76% of private jet flights in 2025 left from the United States (2,374,971 of 3,143,892), and 71.5% of the CO2 (10,484,299 of 14,661,340 t).
1 Raw data (download)
- departures_by_country_top10_2025.csv
2025, every flight (loops included) by country of takeoff: the ten with most flights, with their share of the world total.
2 Step by step
- Take every 2025 row of the flight data (loops included: they burn real fuel): 3,143,892 flights, 14,661,340 t of CO2.
- Group by takeoff country (
departures_by_country_top10_2025.csv, ten largest). United States: 2,374,971 flights, so 2,374,971 / 3,143,892 = 75.54%. - CO2: 10,484,299 t / 14,661,340 t = 71.51%. The graphic rounds the flight share to 76%.
3 Sources
- Flights: monthly "Flights CSV" exports of taxprivatejets.org. Emissions: EUROCONTROL Fast Model, in-flight fuel only (tank-to-wake), well-to-tank switched off. Calculated by The Stats Guy.
- Airport coordinates: OurAirports airports.csv.
4 Caveats and limits
- Counted by where the flight starts, not by where the owner lives.
- Coverage of the tracker is not equal everywhere, so part of the US lead may reflect better tracking there. Emissions are modelled from aircraft type and flight time.
- This stat counts all rows including loops; the stay in the US stat leaves loops out.
The busiest airports for private jet landings
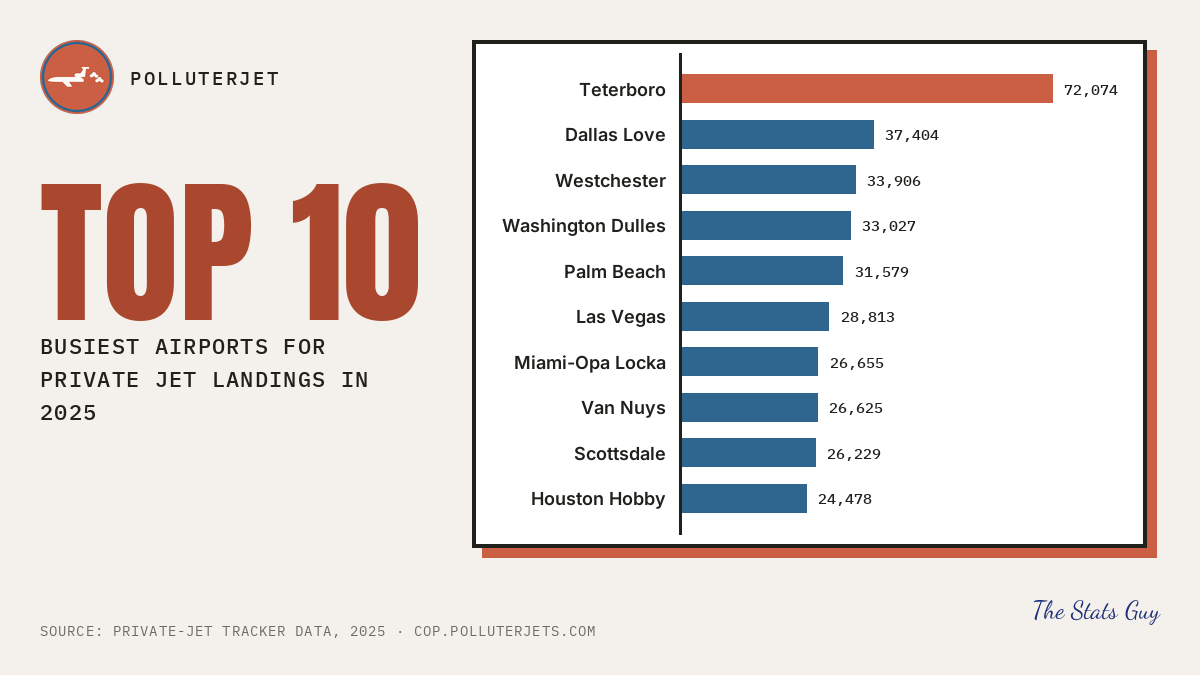
Teterboro, New Jersey (KTEB) was the busiest airport for private jet landings in 2025 with 72,074 landings, then KDAL 37,404, KHPN 33,906.
1 Raw data (download)
- landing_airports_top10_2025.csv
2025, every landing (loops included) counted by landing airport: the ten busiest.
2 Step by step
- Take every 2025 row (loops included) and count rows by landing airport.
- Rank by count and keep the top ten (
landing_airports_top10_2025.csv, with airport names). - Teterboro: 72,074 landings; tenth place (KHOU): 24,478.
3 Sources
- Flights: monthly "Flights CSV" exports of taxprivatejets.org. Emissions: EUROCONTROL Fast Model, in-flight fuel only (tank-to-wake), well-to-tank switched off. Calculated by The Stats Guy.
- Airport coordinates: OurAirports airports.csv.
4 Caveats and limits
- Loops (a flight that lands where it took off) are counted as landings here. Without loops Teterboro has 71,608.
- Landings, not passengers or aircraft: one jet landing many times counts many times.
- Airport names come from the flight data; the graphic shortens them.
The most carbon-intensive private jet routes
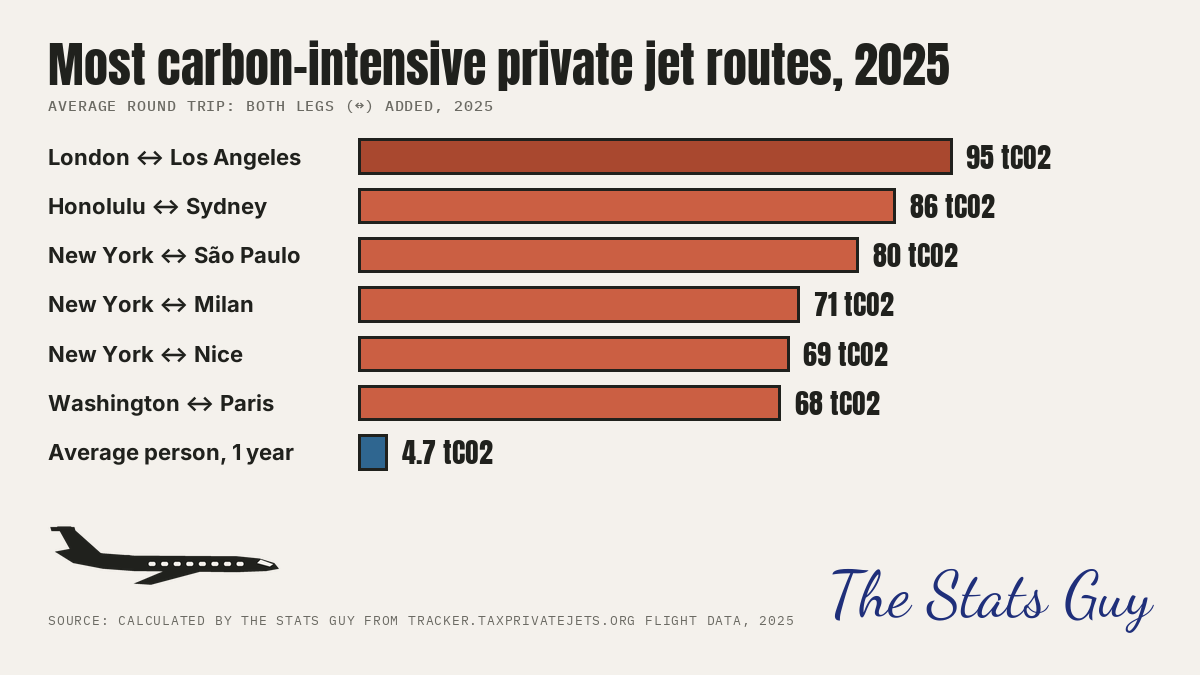
Average round trip: EGGW ↔ KLAX: 95 tCO2, then PHNL↔YSSY 86, KTEB↔SBJH 80, KTEB↔LIML 71.
1 Raw data (download)
- route_pairs_2025.csv
Every airport pair with at least 50 flights in EACH direction in 2025, ranked by round trip (the two one-way means added).
2 Step by step
- Take 2025 flights (takeoff and landing airports differ) with a CO2 value. Group by origin and destination airport; keep pairs with at least 50 flights in each direction.
- For each pair, mean tCO2 per flight A to B plus mean tCO2 per flight B to A = round trip. Rank by round trip (
route_pairs_2025.csv). - The graphic also shows Average person, 1 year: 4.74 tCO2, the world average per person used on the PolluterJet site, as a comparison bar. It is quoted, not recalculated here.
- Airport codes are ICAO (e.g. KTEB Teterboro, EGGW London Luton); the graphic uses the nearest big city's name.
3 Sources
- Flights: monthly "Flights CSV" exports of taxprivatejets.org. Emissions: EUROCONTROL Fast Model, in-flight fuel only (tank-to-wake), well-to-tank switched off. Calculated by The Stats Guy.
- Airport coordinates: OurAirports airports.csv.
- Average person, 1 year: Our World in Data, CO2 emissions per capita (world average).
4 Caveats and limits
- 'Round trip' adds the two one-way averages; it is not one aircraft's actual return flight.
- Needs 50+ flights each way, so rarely flown but very long routes are not ranked.
- Fuel burn is modelled from aircraft type and distance, not measured.
- A flight is a row of the tracker data whose takeoff and landing airports differ. Rows that land where they took off (3.3% of 2025 rows) are left out of every count, because they have no destination. CO2 means tonnes of CO2 from the fuel burned in flight (tank-to-wake); a few rows (0.02% in 2025) have no CO2 value and add nothing to the totals.
Short private jet flights
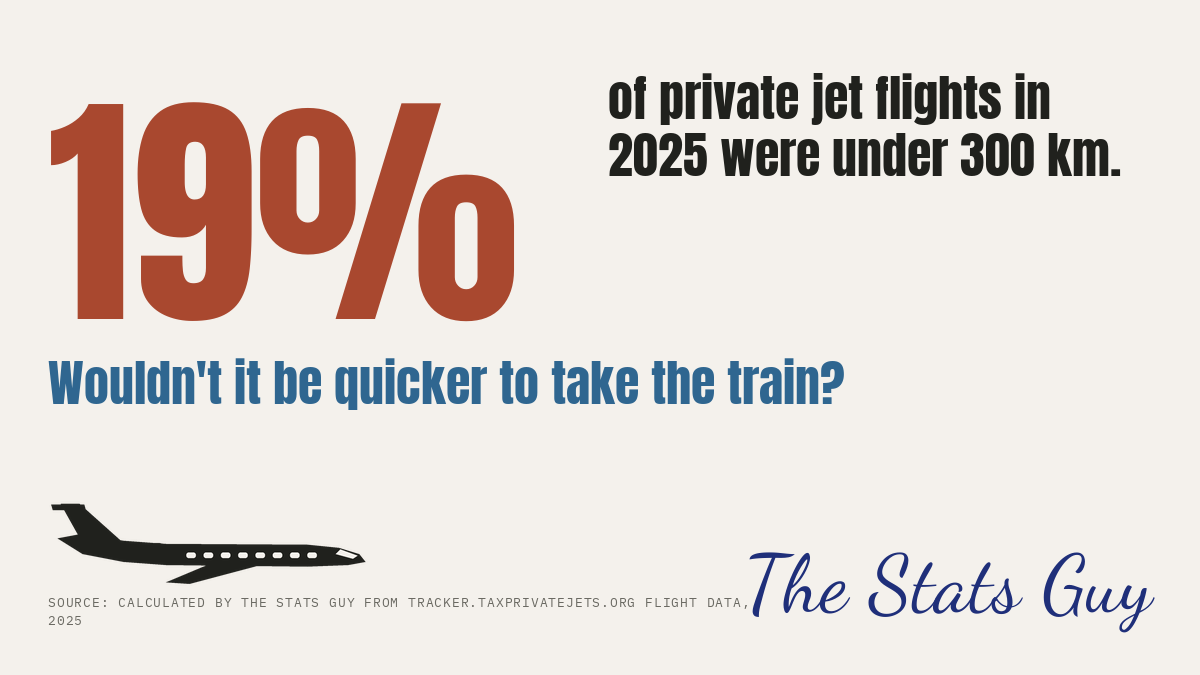
19% of 2025 private-jet flights were under 300 km (582,289 of 3,040,466).
1 Raw data (download)
- distance_bands_2025.csv
2025 flights (takeoff and landing airport different) by great-circle distance band.
2 Step by step
- Take 2025 rows whose takeoff and landing airports differ: 3,040,466.
- Count those with great-circle distance under 300 km: 582,289 (19.15%); under 500 km: 1,074,720 (35.3%).
- Check with
distance_bands_2025.csv(first three rows).
3 Sources
- Flights: monthly "Flights CSV" exports of taxprivatejets.org. Emissions: EUROCONTROL Fast Model, in-flight fuel only (tank-to-wake), well-to-tank switched off. Calculated by The Stats Guy.
- Airport coordinates: OurAirports airports.csv.
4 Caveats and limits
- Loops (103,426 rows) are excluded; with them the share would read 21.8%, but they have no journey to compare with a train.
- A short flight is not always replaceable by train: some routes have no rail link. The graphic asks a question, it does not claim every flight could go by train.
- Distance is as recorded in the source data (great-circle, not flight path).
- A flight is a row of the tracker data whose takeoff and landing airports differ. Rows that land where they took off (3.3% of 2025 rows) are left out of every count, because they have no destination. CO2 means tonnes of CO2 from the fuel burned in flight (tank-to-wake); a few rows (0.02% in 2025) have no CO2 value and add nothing to the totals.
Private jet emissions by country of departure, 2025
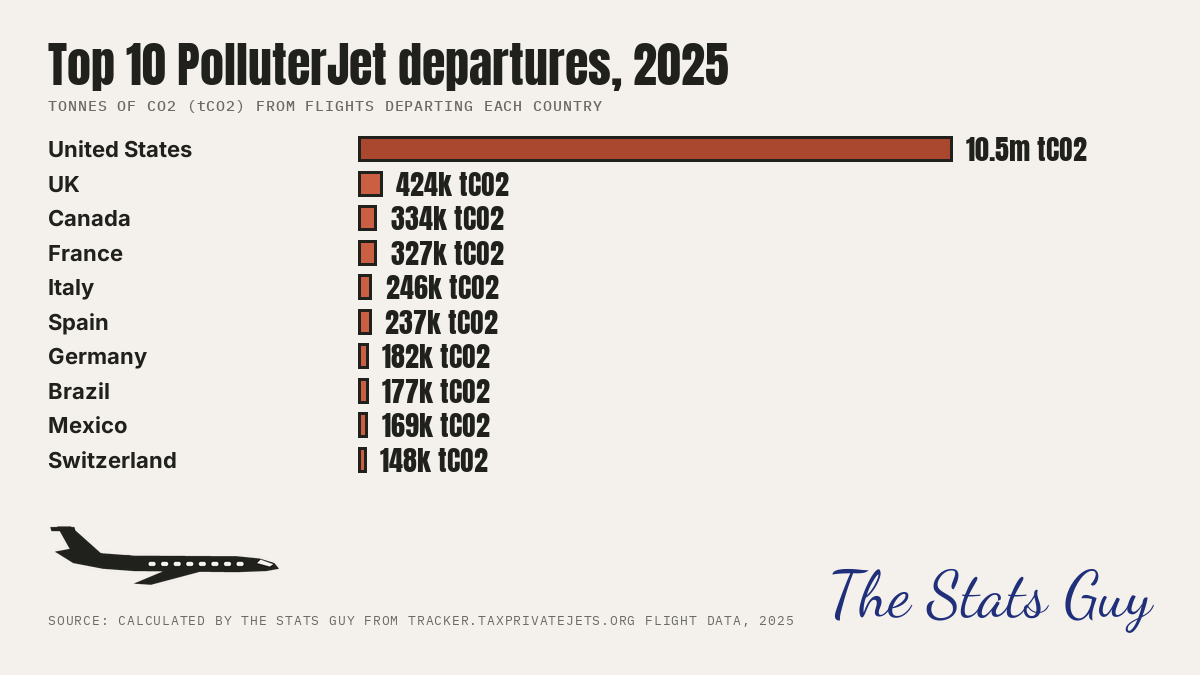
The US accounts for 72% of 2025 private-jet CO2 (10,484,299 of 14,661,340 t) by country of takeoff.
| Country | Flights | tCO2 |
|---|---|---|
| US | 2,374,971 | 10,484,299 |
| GB | 66,931 | 423,942 |
| CA | 71,239 | 333,634 |
| FR | 66,556 | 326,972 |
| IT | 51,189 | 245,507 |
| ES | 43,008 | 236,726 |
| DE | 55,618 | 182,165 |
| BR | 43,007 | 176,769 |
| MX | 39,696 | 169,002 |
| CH | 31,936 | 148,208 |
1 Raw data (download)
- departures_by_country_2025.csv
2025, every flight (including loops, which burn real fuel) by country of takeoff, with tonnes of CO2.
2 Step by step
- Take every 2025 row (loops included: they burn real fuel).
- Group by takeoff country and add tCO2 (
departures_by_country_2025.csv); rank; the top 10 are drawn. - The total of all countries is 14,661,340 t over 3,143,892 flights.
3 Sources
- Flights: monthly "Flights CSV" exports of taxprivatejets.org. Emissions: EUROCONTROL Fast Model, in-flight fuel only (tank-to-wake), well-to-tank switched off. Calculated by The Stats Guy.
- Airport coordinates: OurAirports airports.csv.
4 Caveats and limits
- Counted by where the flight starts, not by where the owner lives.
- Emissions are modelled from aircraft type and flight time.
- Flights with no CO2 value are in the flight count but add no tonnes (see the column in the CSV).
World wealth: who owns it
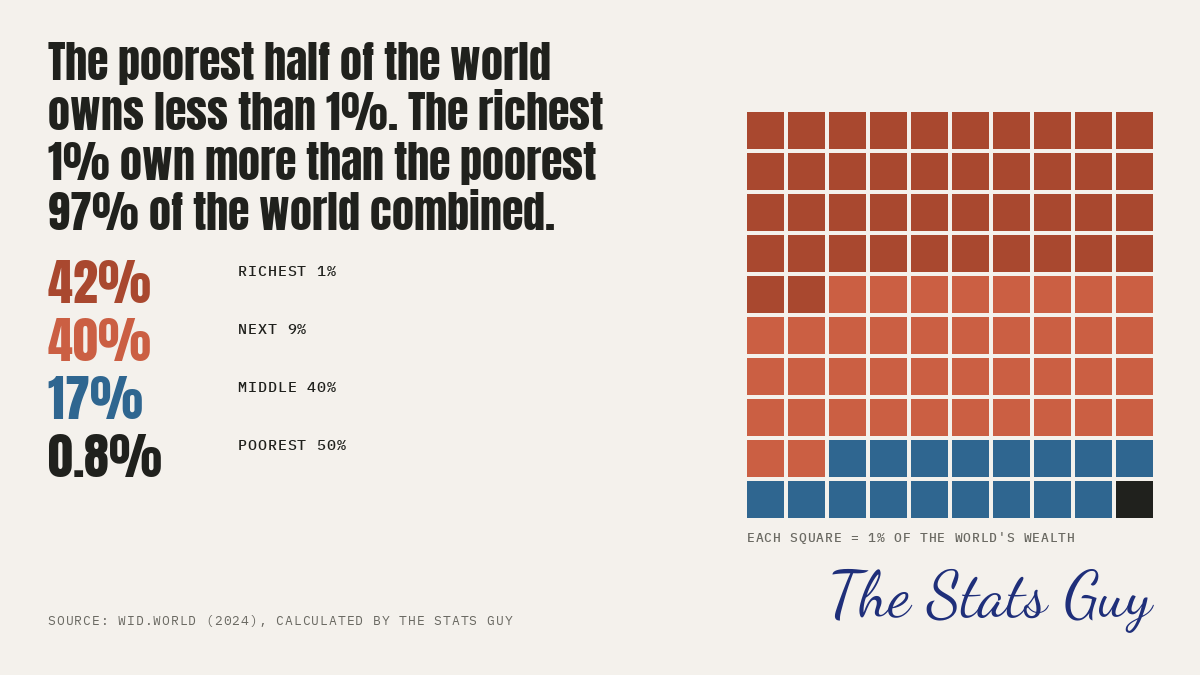
The poorest half of the world owns 0.8% of its wealth; the richest 1% own 42% and the richest 10% own 82% (2024).
1 Raw data (download)
- wid_world_wealth_shares_2024.csv
Every percentile group WID.world publishes for the world in 2024 (share of the total held by the group; p99p100 = the richest 1%).
2 Step by step
- Open
wid_world_wealth_shares_2024.csv. Each row is a percentile group and the share of world net personal wealth it holds. - Poorest 50% = row
p0p50: 0.83%. Middle 40% =p50p90: 17.26%. Richest 10% =p90p100: 81.92%. Richest 1% =p99p100: 42.32%. - Poorest 97% = row
p0p97: 40.22%. The richest 1% hold more than the poorest 97% combined (42.32% against 40.22%). - Next 9% = richest 10% minus richest 1% = 39.60%. The graphic gives each group a number of squares out of 100 (largest-remainder rounding, so the squares add up to exactly 100).
3 Sources
- Data: WID.world (World Inequality Database), world, 2024, net personal wealth of adults (variable
shwealj992, entity WO-MER). WID publishes bulk files at wid.world/data; there is no per-query API, so the full list of percentile groups is in the CSV. Calculated by The Stats Guy.
4 Caveats and limits
- Wealth data are estimates built from surveys, tax and national accounts; for many countries the top is estimated, not observed.
- Shares are of net wealth (assets minus debts), so the poorest groups can hold zero or negative wealth.
- World figures use market exchange rates (the share does not change with the exchange-rate basis chosen here).
Billionaire wealth since 2019
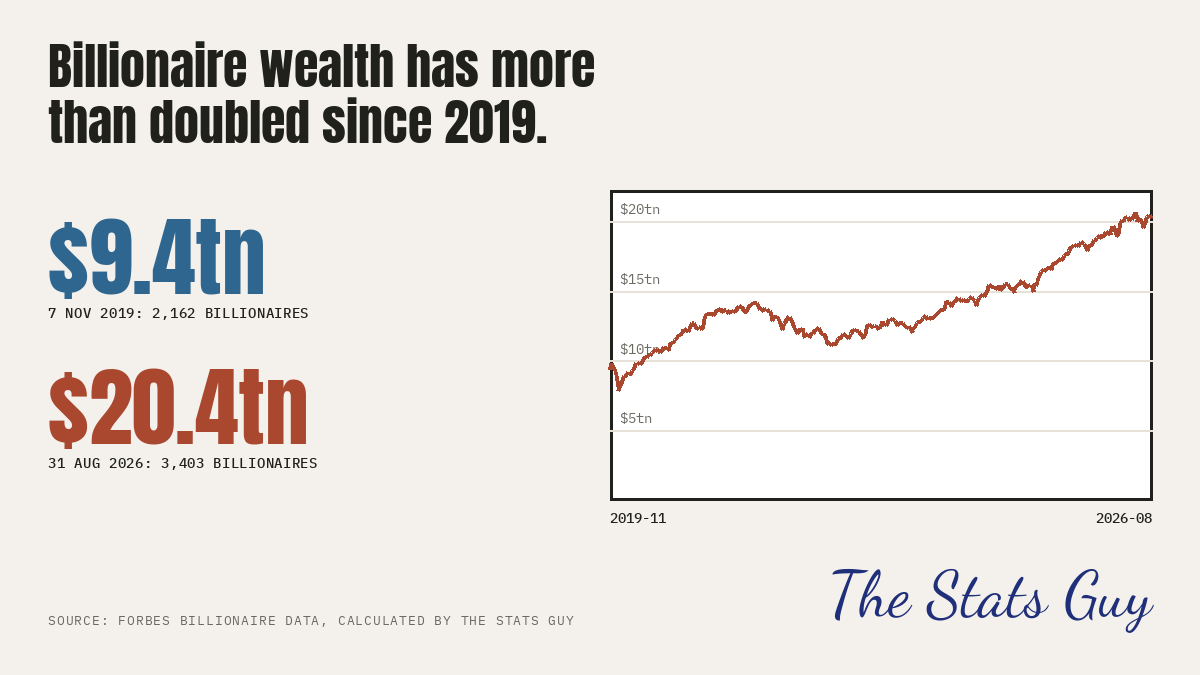
Combined billionaire wealth rose from $9.38 trillion (2,162 billionaires, 7 Nov 2019) to $20.43 trillion (3,403, 31 Aug 2026): 2.18 times.
1 Raw data (download)
- billionaires_daily_totals.csv
Daily count and combined net worth of the world's billionaires (Forbes real-time list), 7 Nov 2019 to 31 Aug 2026.
2 Step by step
- Open
billionaires_daily_totals.csv: one row per day, the number of billionaires and their combined net worth in US dollars. - 7 Nov 2019: 2,162 people, $9,378,242,154,000. 31 Aug 2026: 3,403 people, $20,428,094,778,000.
- Divide: 20,428,094,778,000 / 9,378,242,154,000 = 2.18.
3 Sources
- Data: Forbes real-time billionaires list, daily totals from 7 Nov 2019 (forbes.com/real-time-billionaires; no free API, so the daily totals are in the CSV). Calculated by The Stats Guy.
4 Caveats and limits
- Dollars are not adjusted for inflation: US prices rose over the period, so the real increase is smaller than the nominal one.
- The list changes as Forbes adds and removes people, so part of the rise is new entrants.
- We show totals only, never names.
Jet versus train, door to door
Six short routes, timed with Google Maps for Friday 30 Oct 2026, 16:00:
| Route | Train | Jet | Faster |
|---|---|---|---|
| London to Paris (St Pancras to the Eiffel Tower) | 3h27 | 4h10 | train by 43 min |
| Fort Lauderdale to West Palm Beach | 1h08 | 1h27 | train by 19 min |
| Bordeaux to Paris | 3h04 | 3h13 | train by 9 min |
| Washington to New York | 3h20 | 3h28 | train by 8 min |
| Paris to Brussels | 2h24 | 3h05 | train by 41 min |
| Tokyo to Nagoya | 1h52 | 2h41 | train by 49 min |
London to Paris (St Pancras to the Eiffel Tower)
| Mode | Leg | Minutes | Link / note |
|---|---|---|---|
| train | Eurostar St Pancras to Gare du Nord | 152 | Google Maps |
| train | Walk to Metro 4 | 7 | Google Maps |
| train | Metro 4 Gare du Nord to Cite | 11 | Google Maps |
| train | Walk Cite to Saint-Michel | 4 | Google Maps |
| train | RER C to Champ de Mars | 10 | Google Maps |
| train | Walk to the Eiffel Tower | 8 | Google Maps |
| train | Allowance: international train check-in | 15 | rule set by the Stats Guy |
| jet | Drive from start to EGKB | 100 | Google Maps |
| jet | Airport check-in (international) | 30 | rule set by the Stats Guy |
| jet | Flight EGKB to LFPB (median of tracked flights) | 55 | median duration of 818 flights in world data (see jet_pair_flights.csv |
| jet | Leave plane and reach the car | 15 | rule set by the Stats Guy |
| jet | Drive from LFPB to the destination | 50 | Google Maps |
Fort Lauderdale to West Palm Beach
| Mode | Leg | Minutes | Link / note |
|---|---|---|---|
| train | Walk to Fort Lauderdale Brightline | 8 | Google Maps |
| train | Brightline to West Palm Beach | 45 | Google Maps |
| train | Walk to destination | 10 | Google Maps |
| train | Allowance: walk to platform | 5 | rule set by the Stats Guy |
| jet | Drive from start to KFLL | 20 | Google Maps |
| jet | Airport check-in (domestic) | 15 | rule set by the Stats Guy |
| jet | Flight KFLL to KPBI (median of tracked flights) | 23 | median duration of 1893 flights in world data (see jet_pair_flights.cs |
| jet | Leave plane and reach the car | 15 | rule set by the Stats Guy |
| jet | Drive from KPBI to the destination | 14 | Google Maps |
Bordeaux to Paris
| Mode | Leg | Minutes | Link / note |
|---|---|---|---|
| train | Walk to tram | 3 | Google Maps |
| train | Tram F to Gare Saint-Jean | 11 | Google Maps |
| train | Walk to the station | 3 | Google Maps |
| train | OUIGO Bordeaux to Paris Montparnasse | 140 | Google Maps |
| train | Walk in Montparnasse | 11 | Google Maps |
| train | Metro 4 | 7 | Google Maps |
| train | Walk to destination | 4 | Google Maps |
| train | Allowance: walk to platform | 5 | rule set by the Stats Guy |
| jet | Drive from start to LFBD | 35 | Google Maps |
| jet | Airport check-in (domestic) | 15 | rule set by the Stats Guy |
| jet | Flight LFBD to LFPB (median of tracked flights) | 63 | median duration of 462 flights in world data (see jet_pair_flights.csv |
| jet | Leave plane and reach the car | 15 | rule set by the Stats Guy |
| jet | Drive from LFPB to the destination | 65 | Google Maps |
Washington to New York
| Mode | Leg | Minutes | Link / note |
|---|---|---|---|
| train | Walk in Union Station | 2 | Google Maps |
| train | Acela Washington to New York Penn | 179 | Google Maps |
| train | Walk to subway | 6 | Google Maps |
| train | Subway to 42 St | 2 | Google Maps |
| train | Walk to Times Square | 6 | Google Maps |
| train | Allowance: walk to platform | 5 | rule set by the Stats Guy |
| jet | Drive from start to KIAD | 55 | Google Maps |
| jet | Airport check-in (domestic) | 15 | rule set by the Stats Guy |
| jet | Flight KIAD to KTEB (median of tracked flights) | 73 | median duration of 4581 flights in world data (see jet_pair_flights.cs |
| jet | Leave plane and reach the car | 15 | rule set by the Stats Guy |
| jet | Drive from KTEB to the destination | 50 | Google Maps |
Paris to Brussels
| Mode | Leg | Minutes | Link / note |
|---|---|---|---|
| train | Walk to Chatelet | 12 | Google Maps |
| train | Metro 4 to Gare du Nord | 9 | Google Maps |
| train | Walk to the Eurostar | 6 | Google Maps |
| train | Eurostar to Brussels-Midi | 91 | Google Maps |
| train | Walk to the local train | 1 | Google Maps |
| train | Train to Brussels-Central | 4 | Google Maps |
| train | Walk to Grand Place | 6 | Google Maps |
| train | Allowance: international train check-in | 15 | rule set by the Stats Guy |
| jet | Drive from start to LFPB | 60 | Google Maps |
| jet | Airport check-in (international) | 30 | rule set by the Stats Guy |
| jet | Flight LFPB to EBBR (median of tracked flights) | 45 | median duration of 242 flights in world data (see jet_pair_flights.csv |
| jet | Leave plane and reach the car | 15 | rule set by the Stats Guy |
| jet | Drive from EBBR to the destination | 35 | Google Maps |
Tokyo to Nagoya
| Mode | Leg | Minutes | Link / note |
|---|---|---|---|
| train | Walk to Tokyo Station platform | 7 | Google Maps |
| train | Tokaido Shinkansen Tokyo to Nagoya | 96 | Google Maps |
| train | Walk to destination | 4 | Google Maps |
| train | Allowance: walk to platform | 5 | rule set by the Stats Guy |
| jet | Drive from start to RJTT | 35 | Google Maps |
| jet | Airport check-in (domestic) | 15 | rule set by the Stats Guy |
| jet | Flight RJTT to RJNA (median of tracked flights) | 61 | median duration of 88 flights in world data (see jet_pair_flights.csv) |
| jet | Leave plane and reach the car | 15 | rule set by the Stats Guy |
| jet | Drive from RJNA to the destination | 35 | Google Maps |
1 Raw data (download)
- train_vs_jet_legs.csv
Every leg of every journey, with the Google Maps link for each timed leg. - train_vs_jet_summary.csv
Totals per route. - jet_pair_flights.csv
Every tracked flight between each route's two airports, both directions, Jan 2025 to Sep 2026.
2 Step by step
- Train: Google Maps transit directions from the start point to the destination, departing Fri 30 Oct 2026 16:00 (the first or fastest rail option, link in the table). Add every walking and in-vehicle leg; ignore waiting (we presume the trains line up perfectly). Add 5 minutes to reach the platform on domestic trains, 15 minutes check-in for international trains (Eurostar).
- Jet: Google Maps driving time from the start to the departure airport (departing 16:00) + 30 min check-in (international) or 15 min (domestic) + the median flight time between the two airports in the tracked flights (
jet_pair_flights.csv) + 15 min to leave the plane and reach the car + Google Maps driving time to the destination, departing at the arrival time. - The faster journey wins; the table shows the difference in minutes. Every leg and every link is in
train_vs_jet_legs.csv.
3 Sources
- Journeys: Google Maps; each timed leg has its own link (open it and read the minutes). The date and time are part of the link.
- Flight times: the tracked flights between the two airports (taxprivatejets.org). Calculated by The Stats Guy.
4 Caveats and limits
- Google Maps reads the time in the link as the local clock at the start. Traffic and timetables for a future Friday are Google's typical values and can change.
- Start and end points are one city-centre point each; the real door-to-door time depends on where you actually start.
- The Eurostar check-in and platform times are our allowances, not measured figures; the jet check-in and leaving-the-plane times are also the Stats Guy's rules.